Urbanization and Temperature
2024 · ArcGIS Pro • Remote Sensing • Raster Analysis
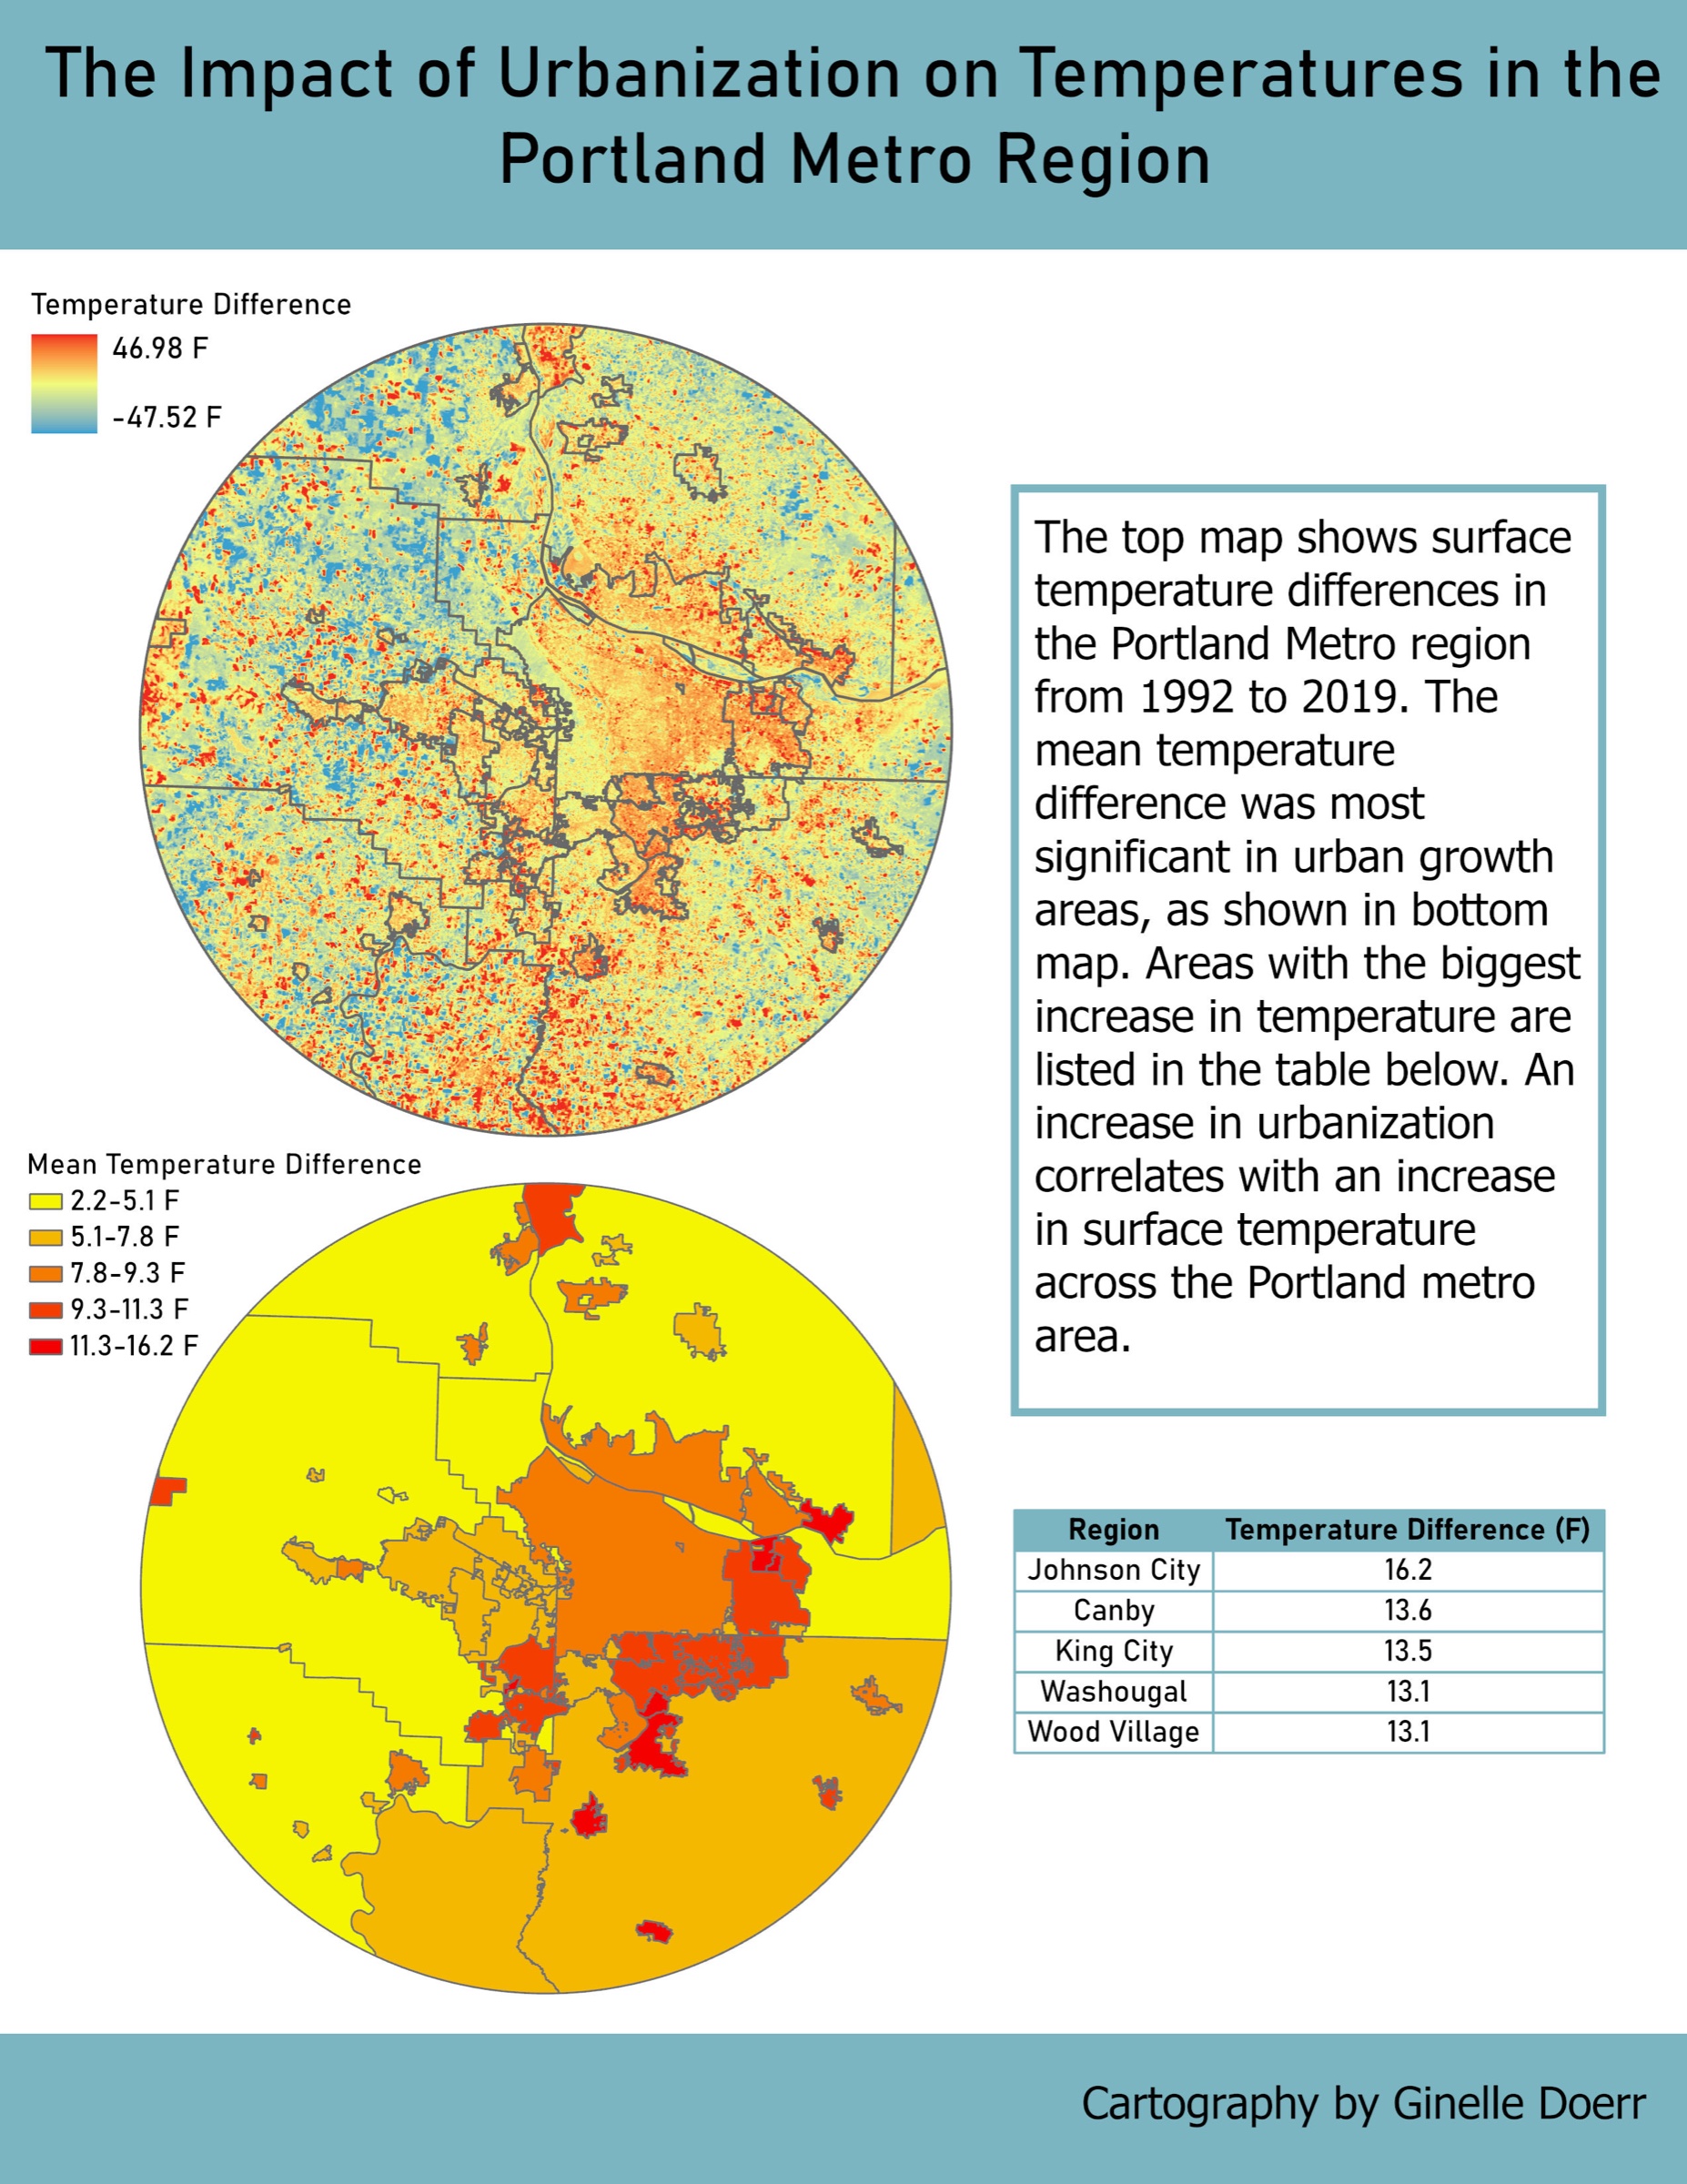
A project using remotely sensed temperature data to examine the change in surface temperatures in the Portland metro region between 1992 and 2019.
The top map shows the surface temperature difference across the region, and the bottom map shows the mean difference by area. The change was most significant in urban growth areas, so an increase in urbanization correlates with an increase in surface temperature. The biggest mean increases were in Johnson City (16.2 °F), Canby (13.6 °F), King City (13.5 °F), Washougal (13.1 °F), and Wood Village (13.1 °F).