Heat Equity Map
2024 · ArcGIS Pro • Raster Analysis • Vector Analysis
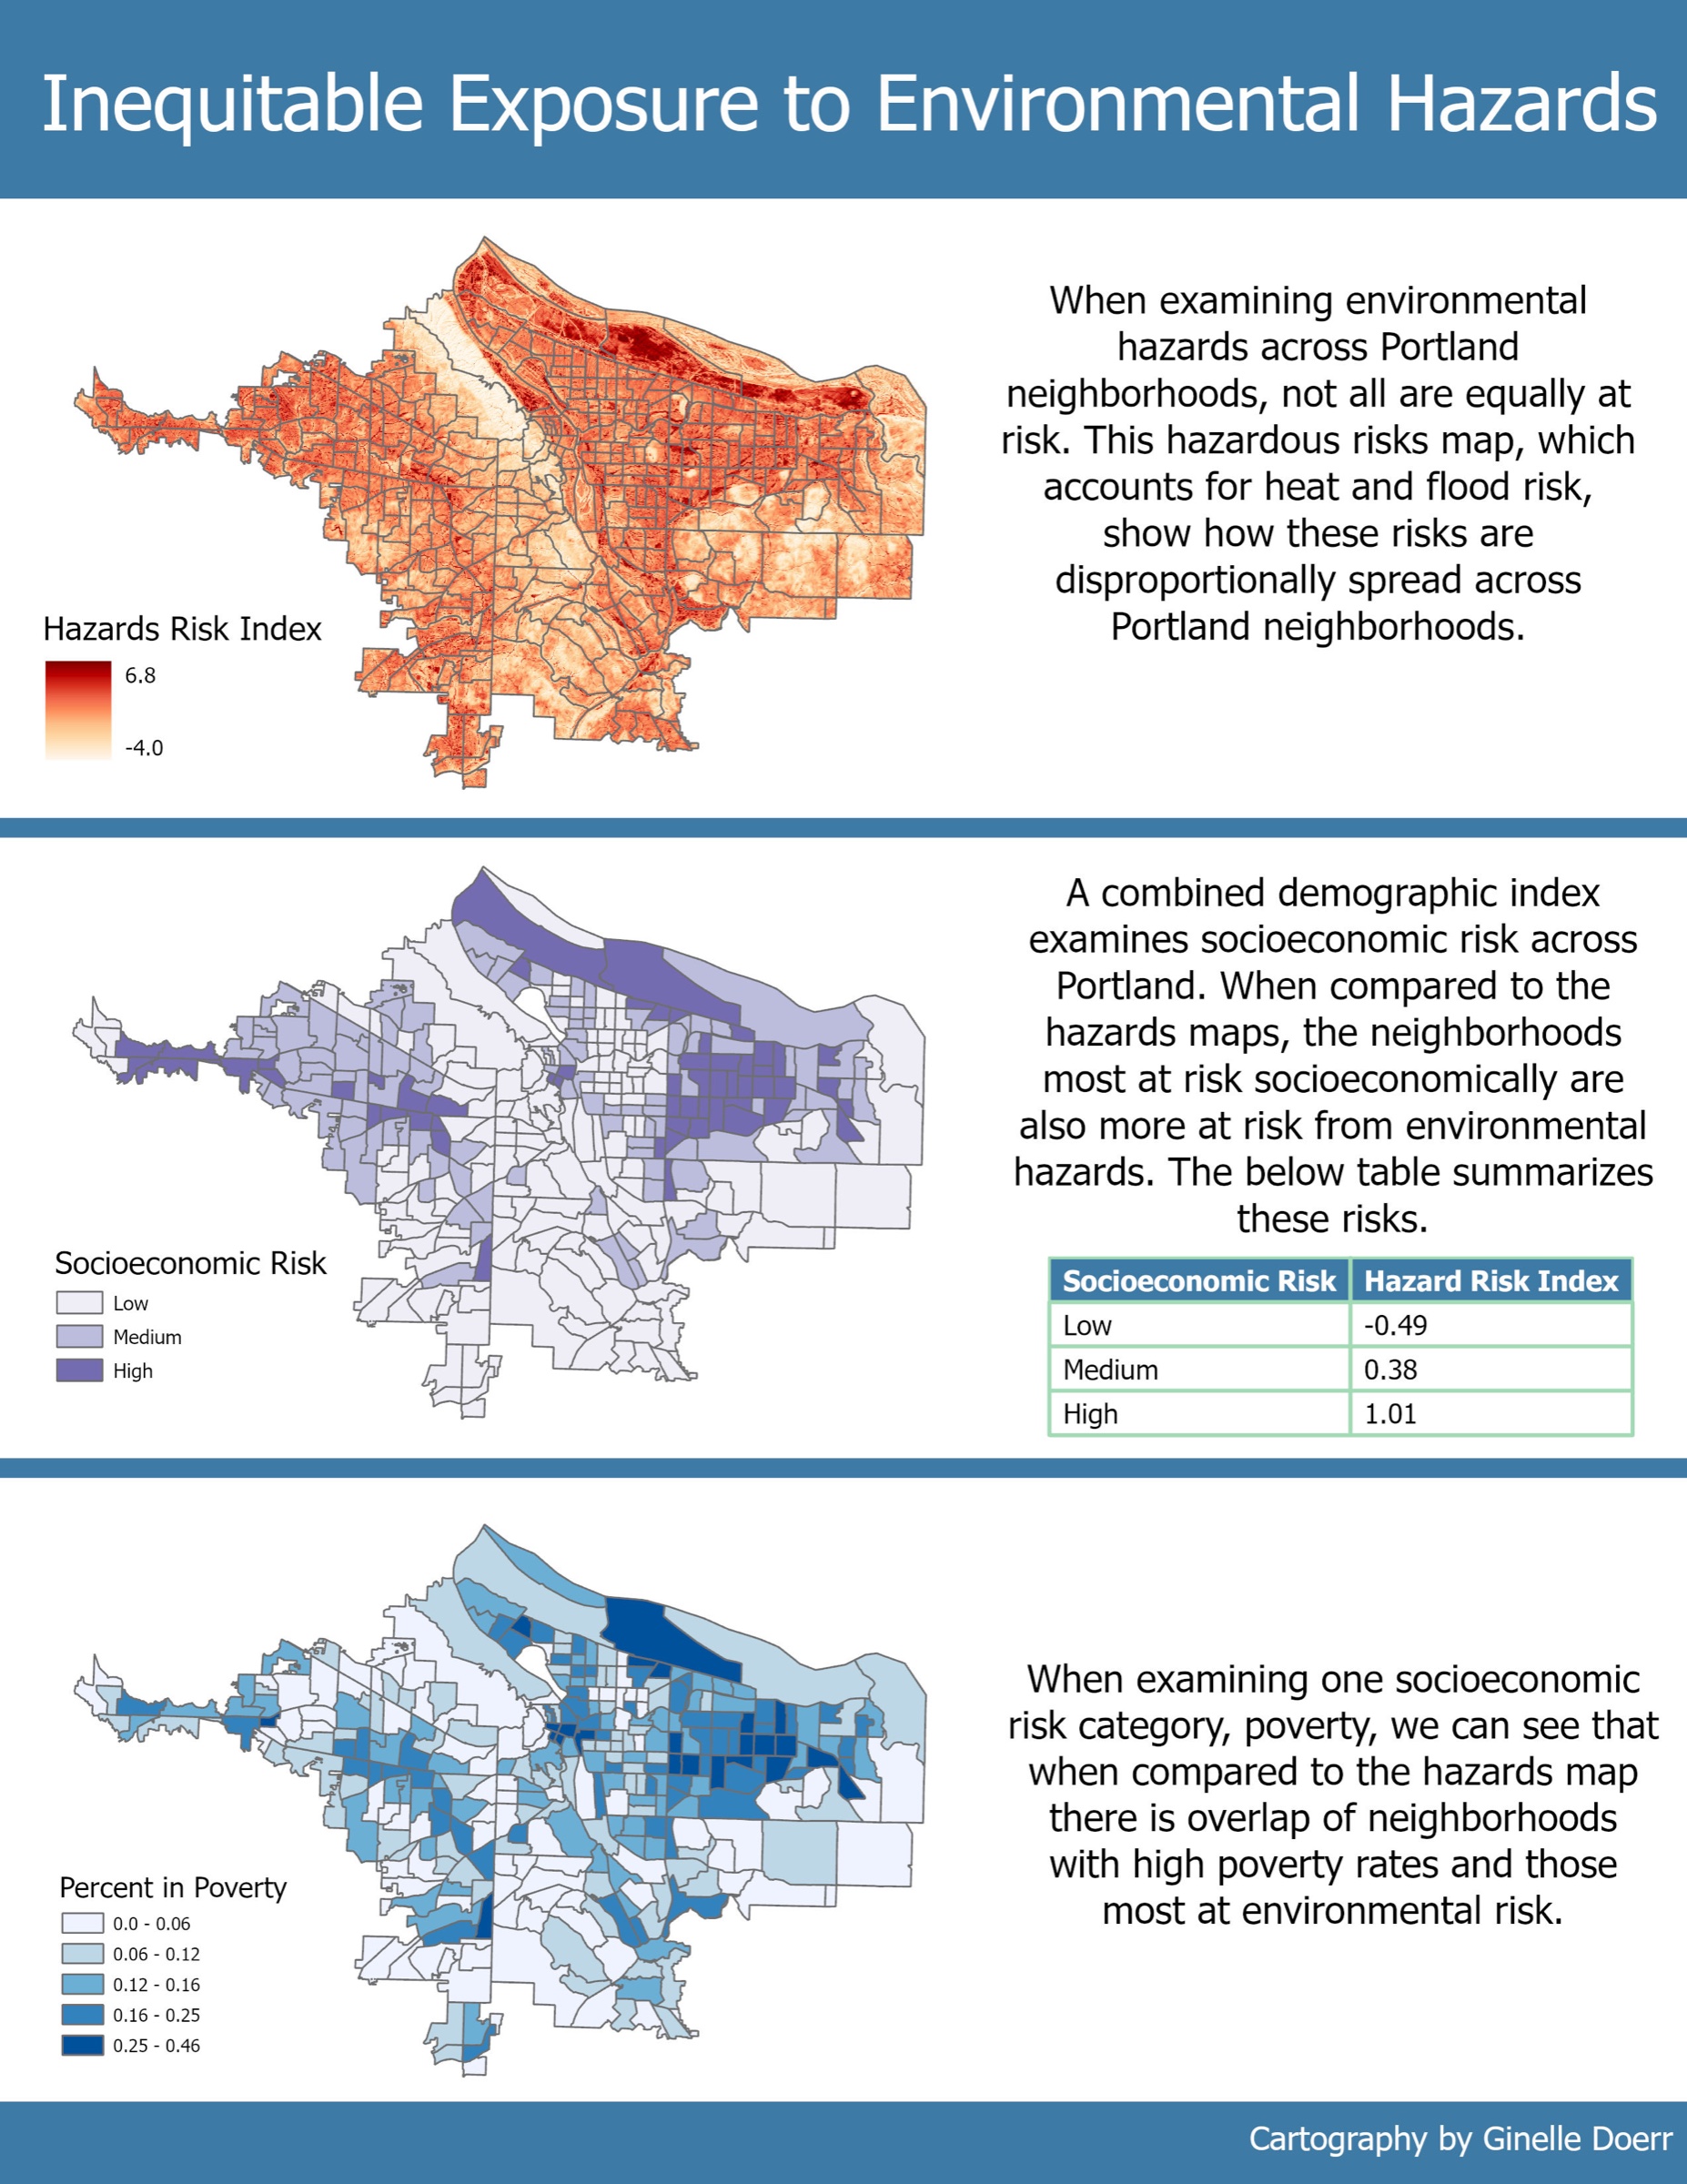
A small class project asking whether Portland’s most socioeconomically vulnerable neighborhoods are also the most exposed to environmental hazards.
I overlaid a hazards risk index, which accounts for heat and flood risk, with a combined demographic index of socioeconomic risk by neighborhood. The neighborhoods at highest socioeconomic risk also had the highest average hazard risk (1.01, compared with -0.49 for the lowest-risk neighborhoods). Looking at poverty on its own showed the same overlap between high poverty rates and high environmental risk.